
- Number 378 |
- December 17, 2012
A human-caused climate change signal emerges from the noise
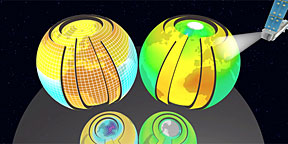
The animation shows a month-by-month
sequence
of atmospheric temperature
changes over the
396-month period from
January 1979 through to
December 2011. The globe on the left displays the
atmospheric temperature changes simulated by a
computer model developed at the National Center
for Atmospheric Research in Boulder, Colo. The
globe on the right shows satellite estimates of
temperature change produced by scientists at
Remote Sensing Systems in Santa Rosa, Calif. As
the two globes rotate, the temperature changes
are visible in three different atmospheric layers.
The outermost layer is the lower stratosphere.
The middle layer is the mid- to upper- troposphere
and the innermost layer is the lower troposphere.
Blue colors indicate cooling; red colors denote
warming.
By comparing simulations from 20 different computer models to satellite observations, climate scientists from DOE's Lawrence Livermore National Laboratory and colleagues from 16 other organizations have found that tropospheric and stratospheric temperature changes are clearly related to human activities.
(See the animation at https://www.llnl.gov/news/video/orbit.mov)
The team looked at geographical patterns of atmospheric temperature change over the period of satellite observations. The team's goal of the study was to determine whether previous findings of a "discernible human influence" on tropospheric and stratospheric temperature were sensitive to current uncertainties in climate models and satellite data.
The troposphere is the lowest portion of Earth's atmosphere. The stratosphere sits just above the troposphere, between six and 30 miles above Earth's surface.
The satellite temperature data sets were produced by three different research groups, and rely on measurements of the microwave emissions of oxygen molecules. Each group made different choices in processing these raw measurements, and in accounting for such complex effects as drifts in satellite orbits and in instrument calibrations.
The new climate model simulations analyzed by the team will form the scientific backbone of the upcoming 5th assessment of the Intergovernmental Panel on Climate Change, which is due out in 2014.
In both satellite observations and the computer model simulations of historical climate change, the lower stratosphere cools markedly over the past 33 years. This cooling is primarily a response to the human-caused depletion of stratospheric ozone. The observations and model simulations also show a common pattern of large-scale warming of the lower troposphere, with largest warming over the Arctic, and muted warming (or even cooling) over Antarctica. Tropospheric warming is mainly driven by human-caused increases in well-mixed greenhouse gases.
"It's very unlikely that purely natural causes can explain these distinctive patterns of temperature change," said Laboratory atmospheric scientist Benjamin Santer, who is lead author of the paper appearing in the Nov. 29 online edition of the journal, Proceedings of the National Academy of Sciences. The paper is Santer's inaugural article as a member of the U.S. National Academy of Sciences.
"No known mode of natural climate variability can cause sustained, global-scale warming of the troposphere and cooling of the lower stratosphere."
Other contributors include researchers from Remote Sensing Systems of Santa Rosa; the Centre for Australian Weather and Climate Research, Melbourne, Australia; the Canadian Centre for Climate Modeling and Analysis, Victoria, Canada; the National Oceanic and Atmospheric Administration (NOAA) Geophysical Fluid Dynamics Laboratory, Princeton; the University of Colorado, Boulder; the Massachusetts Institute of Technology, Cambridge; the U.K. Met. Office Hadley Centre, Exeter, U.K.; the Centre National de la Recherche Scientifique, Toulouse, France; North Carolina State University; the National Climatic Data Center, Asheville; Lawrence Berkeley National Laboratory; the National Center for Atmospheric Research, Boulder; the University of Adelaide, South Australia; the University of Reading, U.K.; and the Center for Satellite Applications and Research, Camp Springs.[Anne Stark, 925.422.9799,
Stark8@llnl.gov]