The one-body density matrix, defined in equation 7.1, is
conventionally expanded in a basis of orbitals, ![]() , where
, where
The diagonal elements, ![]() , are commonly referred to as the
orbital occupation numbers. For wave functions consisting of a single
determinant, such as HF or LDA wave functions, the density matrix is
idempotent
, are commonly referred to as the
orbital occupation numbers. For wave functions consisting of a single
determinant, such as HF or LDA wave functions, the density matrix is
idempotent ![]() and takes the form of a sum over the
occupied orbitals, i.e.,
and takes the form of a sum over the
occupied orbitals, i.e.,
 |
(7.3) |
so that the occupation numbers are 2 (including spin degeneracy) for occupied orbitals and 0 for unoccupied orbitals.
The matrix elements of the interacting density matrix, ![]() ,
are written as expectation values over the distribution
,
are written as expectation values over the distribution
![]() :
:
The permutation symmetry allows a rewriting of
equation 7.4 in an efficient way for Monte
Carlo evaluation. Denoting the average over the distribution,
![]() , as
, as
![]() , the Monte Carlo
expectation value is rewritten as
, the Monte Carlo
expectation value is rewritten as
The integral over
![]() is performed by summing over a
grid of uniform spacing whose origin is chosen randomly for each
electron configuration. The same grid in
is performed by summing over a
grid of uniform spacing whose origin is chosen randomly for each
electron configuration. The same grid in
![]() is used for
each term in equation 7.5, which further reduces the
computational cost. A series of grid sizes were tested for the
is used for
each term in equation 7.5, which further reduces the
computational cost. A series of grid sizes were tested for the
![]() integral, using identical configurations for each grid size
to obtain a correlated sampling estimate[23]
of the difference between the integrals. A grid containing 125 points
in the simulation cell was tested and found to sample the integral
with sufficient numerical accuracy.
integral, using identical configurations for each grid size
to obtain a correlated sampling estimate[23]
of the difference between the integrals. A grid containing 125 points
in the simulation cell was tested and found to sample the integral
with sufficient numerical accuracy.
Provided that the density of points in the
![]() integral
is kept constant, the statistical error in the individual elements of
the density matrix for a given number of statistically independent
configurations is approximately independent of system size.
integral
is kept constant, the statistical error in the individual elements of
the density matrix for a given number of statistically independent
configurations is approximately independent of system size.
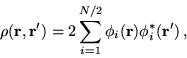
A basis set consisting of the lowest energy LDA orbitals at the 27 k-points in the primitive Brillouin zone was used. LDA orbitals were expected to form an efficient basis for the density matrix as the quasiparticle orbitals of silicon are very close to the LDA orbitals. The effect of varying the number of orbitals in the basis was tested, and approximately 40 orbitals per k-point were sufficient, although to retain the symmetry all rows of a degenerate representation (a degeneracy) were included, so that the actual number used was either 39 or 40 orbitals, depending on the k-point.
The normalization used in equation 7.1 requires that
| (7.6) |
The 582 matrix elements were sampled using approximately 6.6![]() statistically independent configurations. The correlation
lengths along the VMC walks of both the local energy and density
matrix were found to be essentially the same.
statistically independent configurations. The correlation
lengths along the VMC walks of both the local energy and density
matrix were found to be essentially the same.
Elements of the accumulated density matrix, ![]() , are shown in
figure 7.1. The accumulated density matrix,
, are shown in
figure 7.1. The accumulated density matrix,
![]() , was very nearly diagonal with little coupling between LDA
orbitals. The occupation numbers decrease almost linearly with
increasing LDA energy for both the occupied and unoccupied bands.
, was very nearly diagonal with little coupling between LDA
orbitals. The occupation numbers decrease almost linearly with
increasing LDA energy for both the occupied and unoccupied bands.
Denoting double occupancy (spin-up and down) of orbitals by the value
![]() , the maximum difference between an interacting occupation
number,
, the maximum difference between an interacting occupation
number, ![]() , and the LDA occupation number was
, and the LDA occupation number was
![]() . This difference occurred at the
. This difference occurred at the ![]() state at
the top of the valence band. The magnitude of the largest off-diagonal
matrix element was
state at
the top of the valence band. The magnitude of the largest off-diagonal
matrix element was ![]() , which is of similar order to the
occupation number of the lowest unoccupied orbitals. The fractional
errors in occupation numbers for orbitals of low occupation were large
in comparison to those of high occupation. Approximately
, which is of similar order to the
occupation number of the lowest unoccupied orbitals. The fractional
errors in occupation numbers for orbitals of low occupation were large
in comparison to those of high occupation. Approximately ![]() of
the total occupation of the density matrix is contained within the
four occupied LDA bands at each k-point, and
of
the total occupation of the density matrix is contained within the
four occupied LDA bands at each k-point, and ![]() is
obtained within the first ten bands.
is
obtained within the first ten bands.
![\includegraphics [width=10cm]{Figures/ekt_fig1.eps}](pkthimg726.gif)
|
In figure 7.2 the density matrix,
![]() , in the (110) plane. The coordinate
, in the (110) plane. The coordinate ![]() is
fixed at the center of a covalent bond, and
is
fixed at the center of a covalent bond, and
![]() ranges
over the (110) plane passing through the atomic positions. The small
differences between the VMC and LDA matrices are shown separately. The
density matrix consists of an asymmetric central peak, reduced in
width along the bonding direction. A longer ranged structure is
present in areas of high valence charge density, smaller by
approximately one order of magnitude than the peak.
ranges
over the (110) plane passing through the atomic positions. The small
differences between the VMC and LDA matrices are shown separately. The
density matrix consists of an asymmetric central peak, reduced in
width along the bonding direction. A longer ranged structure is
present in areas of high valence charge density, smaller by
approximately one order of magnitude than the peak.
![\includegraphics [width=10cm]{Figures/ekt_fig2a.eps}](pkthimg732.gif)
![\includegraphics [width=10cm]{Figures/ekt_fig2b.eps}](pkthimg733.gif)
|
The VMC value for the peak in the density matrix on the bond center at
![]() is
is ![]() smaller than the LDA
value. The VMC density matrix has a larger magnitude around the
neighboring silicon ions than the LDA density matrix, which
consequently has a slightly smaller range. The density matrix was
examined in the interstitial regions, where more structure was found.
Again, the LDA and VMC results were very similar, with small
differences between the two cases arising principally from the
differing charge densities.
smaller than the LDA
value. The VMC density matrix has a larger magnitude around the
neighboring silicon ions than the LDA density matrix, which
consequently has a slightly smaller range. The density matrix was
examined in the interstitial regions, where more structure was found.
Again, the LDA and VMC results were very similar, with small
differences between the two cases arising principally from the
differing charge densities.
To investigate the possible finite size effects the LDA density
matrices were computed for 3![]() 3
3![]() 3 and 4
3 and 4![]() 4
4![]() 4
k-point meshes, corresponding to simulation cells containing 54
and 128 atoms respectively. The central peak was largely unchanged and
the longer ranged structure was in qualitative agreement. The central
maximum in the density matrix, in figure 7.2, is at
the point
4
k-point meshes, corresponding to simulation cells containing 54
and 128 atoms respectively. The central peak was largely unchanged and
the longer ranged structure was in qualitative agreement. The central
maximum in the density matrix, in figure 7.2, is at
the point
![]() and its magnitude is
directly proportional to the valence charge density at that point,
which differed by
and its magnitude is
directly proportional to the valence charge density at that point,
which differed by ![]() between the two simulation cell sizes.
These differences are small and indicate that no significant
deviations between the LDA and VMC results are likely to be resolved
by using a larger cell.
between the two simulation cell sizes.
These differences are small and indicate that no significant
deviations between the LDA and VMC results are likely to be resolved
by using a larger cell.
In exact Kohn-Sham density functional theory the total energy can be
written entirely in terms of the one-body density matrix of the
Kohn-Sham orbitals, whereas in a fully interacting system both the
one-body density matrix and the pair-correlation function are
required. Results for the pair-correlation function from accurate
correlated wave functions and LDA calculations are extremely
different.[14] Exact Kohn-Sham density functional
theory reproduces the exact charge density and therefore exactly
reproduces the diagonal
![]() part of the density
matrix. The off-diagonal part of the exact Kohn-Sham and interacting
density matrices are not required to be the same. In silicon the LDA
is expected to give a good approximation to the exact Kohn-Sham
density matrix, as the LDA performs very well. For this system the
results show that the entire density matrix is very similar
in VMC and LDA. It is reasonable to speculate that the exact Kohn-Sham
and exact one-body density matrices are probably very similar in
other covalent sp systems.
part of the density
matrix. The off-diagonal part of the exact Kohn-Sham and interacting
density matrices are not required to be the same. In silicon the LDA
is expected to give a good approximation to the exact Kohn-Sham
density matrix, as the LDA performs very well. For this system the
results show that the entire density matrix is very similar
in VMC and LDA. It is reasonable to speculate that the exact Kohn-Sham
and exact one-body density matrices are probably very similar in
other covalent sp systems.
The natural orbitals were obtained by diagonalising the density matrix
in the basis of the LDA orbitals. An assessment of the statistical
errors in the eigenvalues and eigenvectors was made by subjecting the
matrix to random perturbations of order the statistical error. The
eigenvalues varied by up to ![]() on application of the small
perturbations. All the calculated eigenvalues,
on application of the small
perturbations. All the calculated eigenvalues, ![]() , of the
density matrix lie in the range
, of the
density matrix lie in the range
![]() ,
as is required.[109,110,111] Identical results were
obtained when elements within statistical error of zero were
explicitly zeroed. The overlap of the space occupied by the LDA
orbitals and the natural orbitals is measured by the
absolute value of the determinant of the matrix of overlaps between
these two sets of vectors. This gave a value of 0.9948, indicating
that the spaces spanned are almost the same.
,
as is required.[109,110,111] Identical results were
obtained when elements within statistical error of zero were
explicitly zeroed. The overlap of the space occupied by the LDA
orbitals and the natural orbitals is measured by the
absolute value of the determinant of the matrix of overlaps between
these two sets of vectors. This gave a value of 0.9948, indicating
that the spaces spanned are almost the same.
The eigenvalues of the density matrix for the ``occupied'' natural
orbitals were very slightly larger than the corresponding matrix
elements ![]() (by about
(by about ![]() ). Consequently, the
eigenvalues of the ``unoccupied'' natural orbitals were very slightly
decreased, so that
). Consequently, the
eigenvalues of the ``unoccupied'' natural orbitals were very slightly
decreased, so that
![]() is invariant. Therefore a plot of
the eigenvalues of the density matrix would be indistinguishable from
figure 7.1, which shows the diagonal elements of
the density matrix in the basis of LDA orbitals.
is invariant. Therefore a plot of
the eigenvalues of the density matrix would be indistinguishable from
figure 7.1, which shows the diagonal elements of
the density matrix in the basis of LDA orbitals.
Compton scattering is a form of inelastic x-ray scattering
characterised by large energy and momentum transfer, and can be used
to probe the electronic structure of materials by measuring the
electron momentum distribution and its
anisotropies. [124] Improvements in synchrotron x-ray
sources have led to significant developments of this technique and
resolutions of down to ![]() a.u. (at best) for momenta are
currently possible. In this section, the zero momentum component of
the momentum density for bulk silicon is determined from the density
matrix and compared with previous results for the momentum density and
Compton profile.
a.u. (at best) for momenta are
currently possible. In this section, the zero momentum component of
the momentum density for bulk silicon is determined from the density
matrix and compared with previous results for the momentum density and
Compton profile.
Accurate predictions of Compton profiles are desired to help confirm
the more detailed information about electronic structure that
simulations can provide; from accurate electronic structure
calculations it should be possible to compute the experimentally
observed Compton profile. At the time of writing, most theoretical
calculations of Compton profiles have been computed using a
single-particle framework such as LDA-DFT within the ``impulse
approximation''. [125] Within this
approximation, x-rays are considered to transfer momentum and energy
to free electrons. [125] The Compton
profile, ![]() , is then given in terms of an integral of the
momentum density,
, is then given in terms of an integral of the
momentum density, ![]() ,
,
| (7.7) |
Recently, Králik et al. [126] and Filippi and
Ceperley [127] computed the Compton profiles of bulk
silicon and lithium respectively, using QMC techniques. Large
deviations between experiment and the QMC results were apparent at
small ![]() , although the results did improve on those of LDA-DFT
calculations and were in agreement the Lam-Platzman
correction [128] to the LDA-DFT results. This correction
is in principle exact within DFT, but must be approximated using an
approximate functional such as the LDA. The QMC calculations for bulk
silicon [126] used a small simulation cell of 16
atoms. Hence, it is possible that finite-size effects and not the
impulse approximation could be responsible for the residual
discrepancy between the QMC results and experiment.
, although the results did improve on those of LDA-DFT
calculations and were in agreement the Lam-Platzman
correction [128] to the LDA-DFT results. This correction
is in principle exact within DFT, but must be approximated using an
approximate functional such as the LDA. The QMC calculations for bulk
silicon [126] used a small simulation cell of 16
atoms. Hence, it is possible that finite-size effects and not the
impulse approximation could be responsible for the residual
discrepancy between the QMC results and experiment.
The value of ![]() is given by equation 7.8 in terms of
the natural orbitals of the density matrix and their
occupancies.
is given by equation 7.8 in terms of
the natural orbitals of the density matrix and their
occupancies. ![]() was evaluated using the VMC density matrix for the
54 atom system used in this chapter. The results are shown in table
7.1 in terms of the difference between the VMC and LDA-DFT
values.
was evaluated using the VMC density matrix for the
54 atom system used in this chapter. The results are shown in table
7.1 in terms of the difference between the VMC and LDA-DFT
values.
|
Although a larger supercell is used in this work, the value of ![]() obtained is in good agreement with Králik et al. and has a
smaller statistical error. This result strongly suggests that the
finite size effects in the calculations are small, and that a similar
Compton profile would be obtained if a full calculation was performed
for the larger cell. In a later paper on the Compton profile of
silicon,[129] Delaney et al. report that the
effect of using pseudopotentials on the Compton profile is also small.
obtained is in good agreement with Králik et al. and has a
smaller statistical error. This result strongly suggests that the
finite size effects in the calculations are small, and that a similar
Compton profile would be obtained if a full calculation was performed
for the larger cell. In a later paper on the Compton profile of
silicon,[129] Delaney et al. report that the
effect of using pseudopotentials on the Compton profile is also small.
Filippi et al. [127] performed DMC
calculations as well as VMC calculations for lithium. They found only
very small differences in the momentum distribution between the two
calculations indicating the VMC wavefunctions are of sufficient
quality for this work. They also found deviations between experiment
and the QMC results at small ![]() .
.
These results strongly support the conclusion that the residual difference between experiment and theory is not due to the treatment of electron-electron correlation in these materials. The residual differences in both silicon and lithium are therefore most likely due to a breakdown of the impulse approximation [125], although there may also be contributions from finite temperature effects that are not accounted in the experimental analysis.