Idaho Power webinar
Task 2 and 3 updates
Nathan Sutton
Oak Ridge National Lab
Subtask 2a
Implement a hatchery model for the Brownlee reach and demonstrate the ability to simulate collection of 6 vs. 20 broodstock.
Existing hatchery function
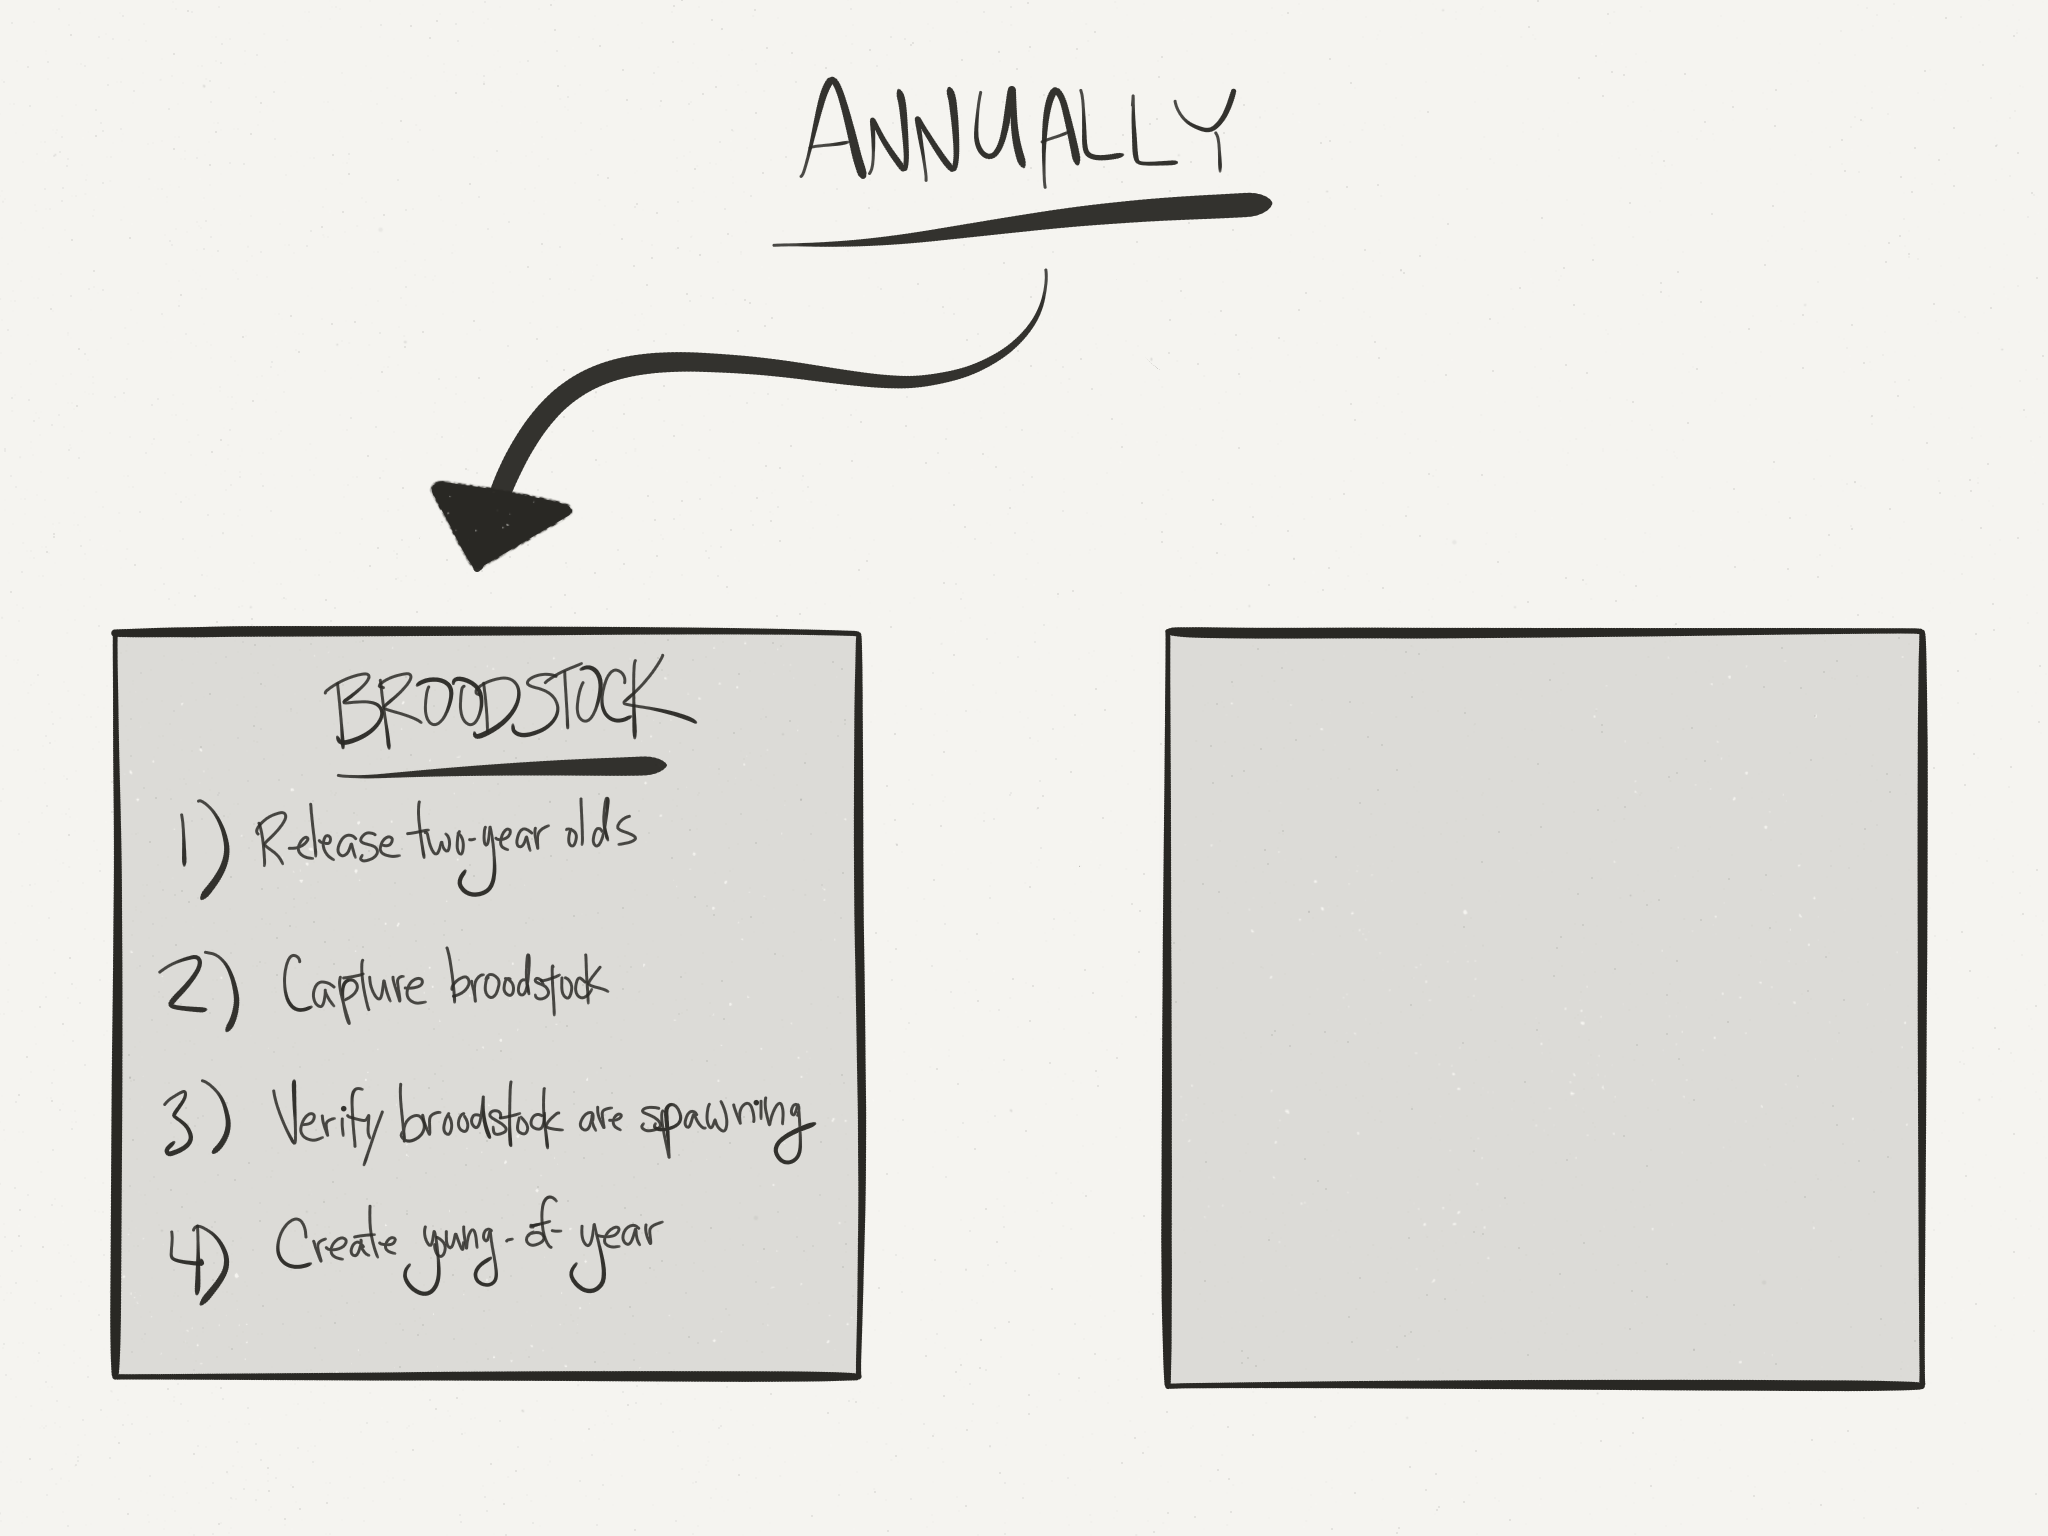
Hatchery function operating as expected
- Number/ origin of broodstock controlled by input parameters Tquota and Tsource
- Stocking juveniles increases population size in target reach
Subtask 2d
Estimate appropriate stocking numbers for broodstock capture of 6 vs. 20 adults to minimize genetic introgression over the long-term.
Appropriate stocking numbers
Subtask 3a
Implement the ability to simulate larval collection and repatriation in the PVA model
Modified hatchery function
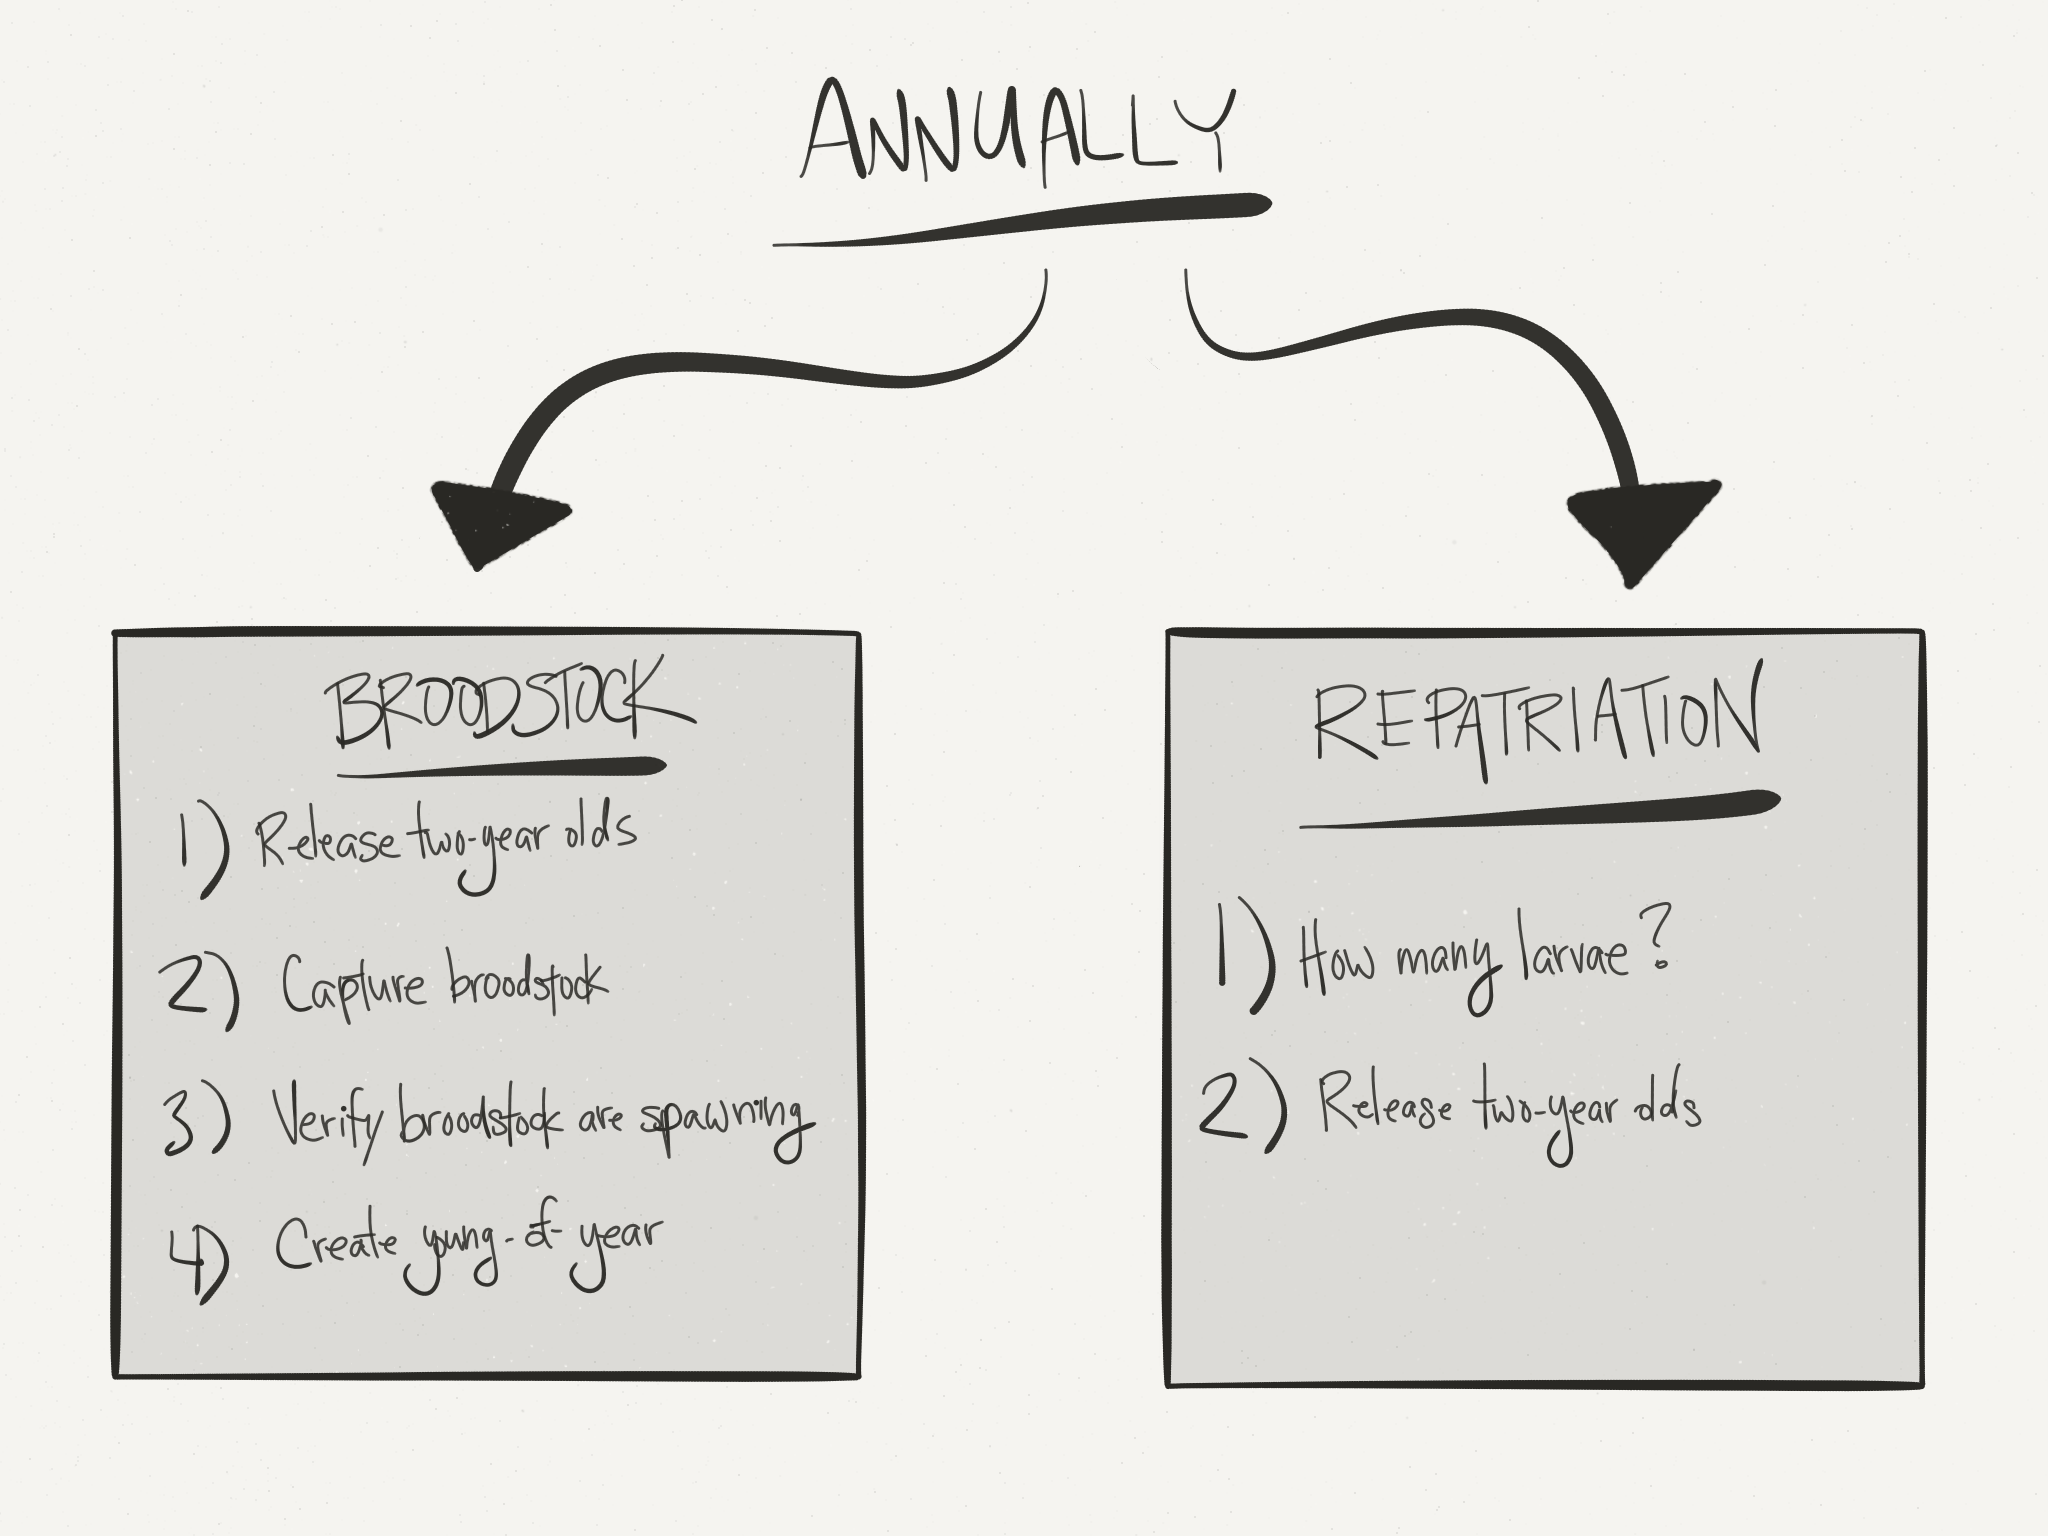
Stocking numbers decreased w/ repatriation
Subtask 3b
Simulate the scenario with no change in water quality and document results
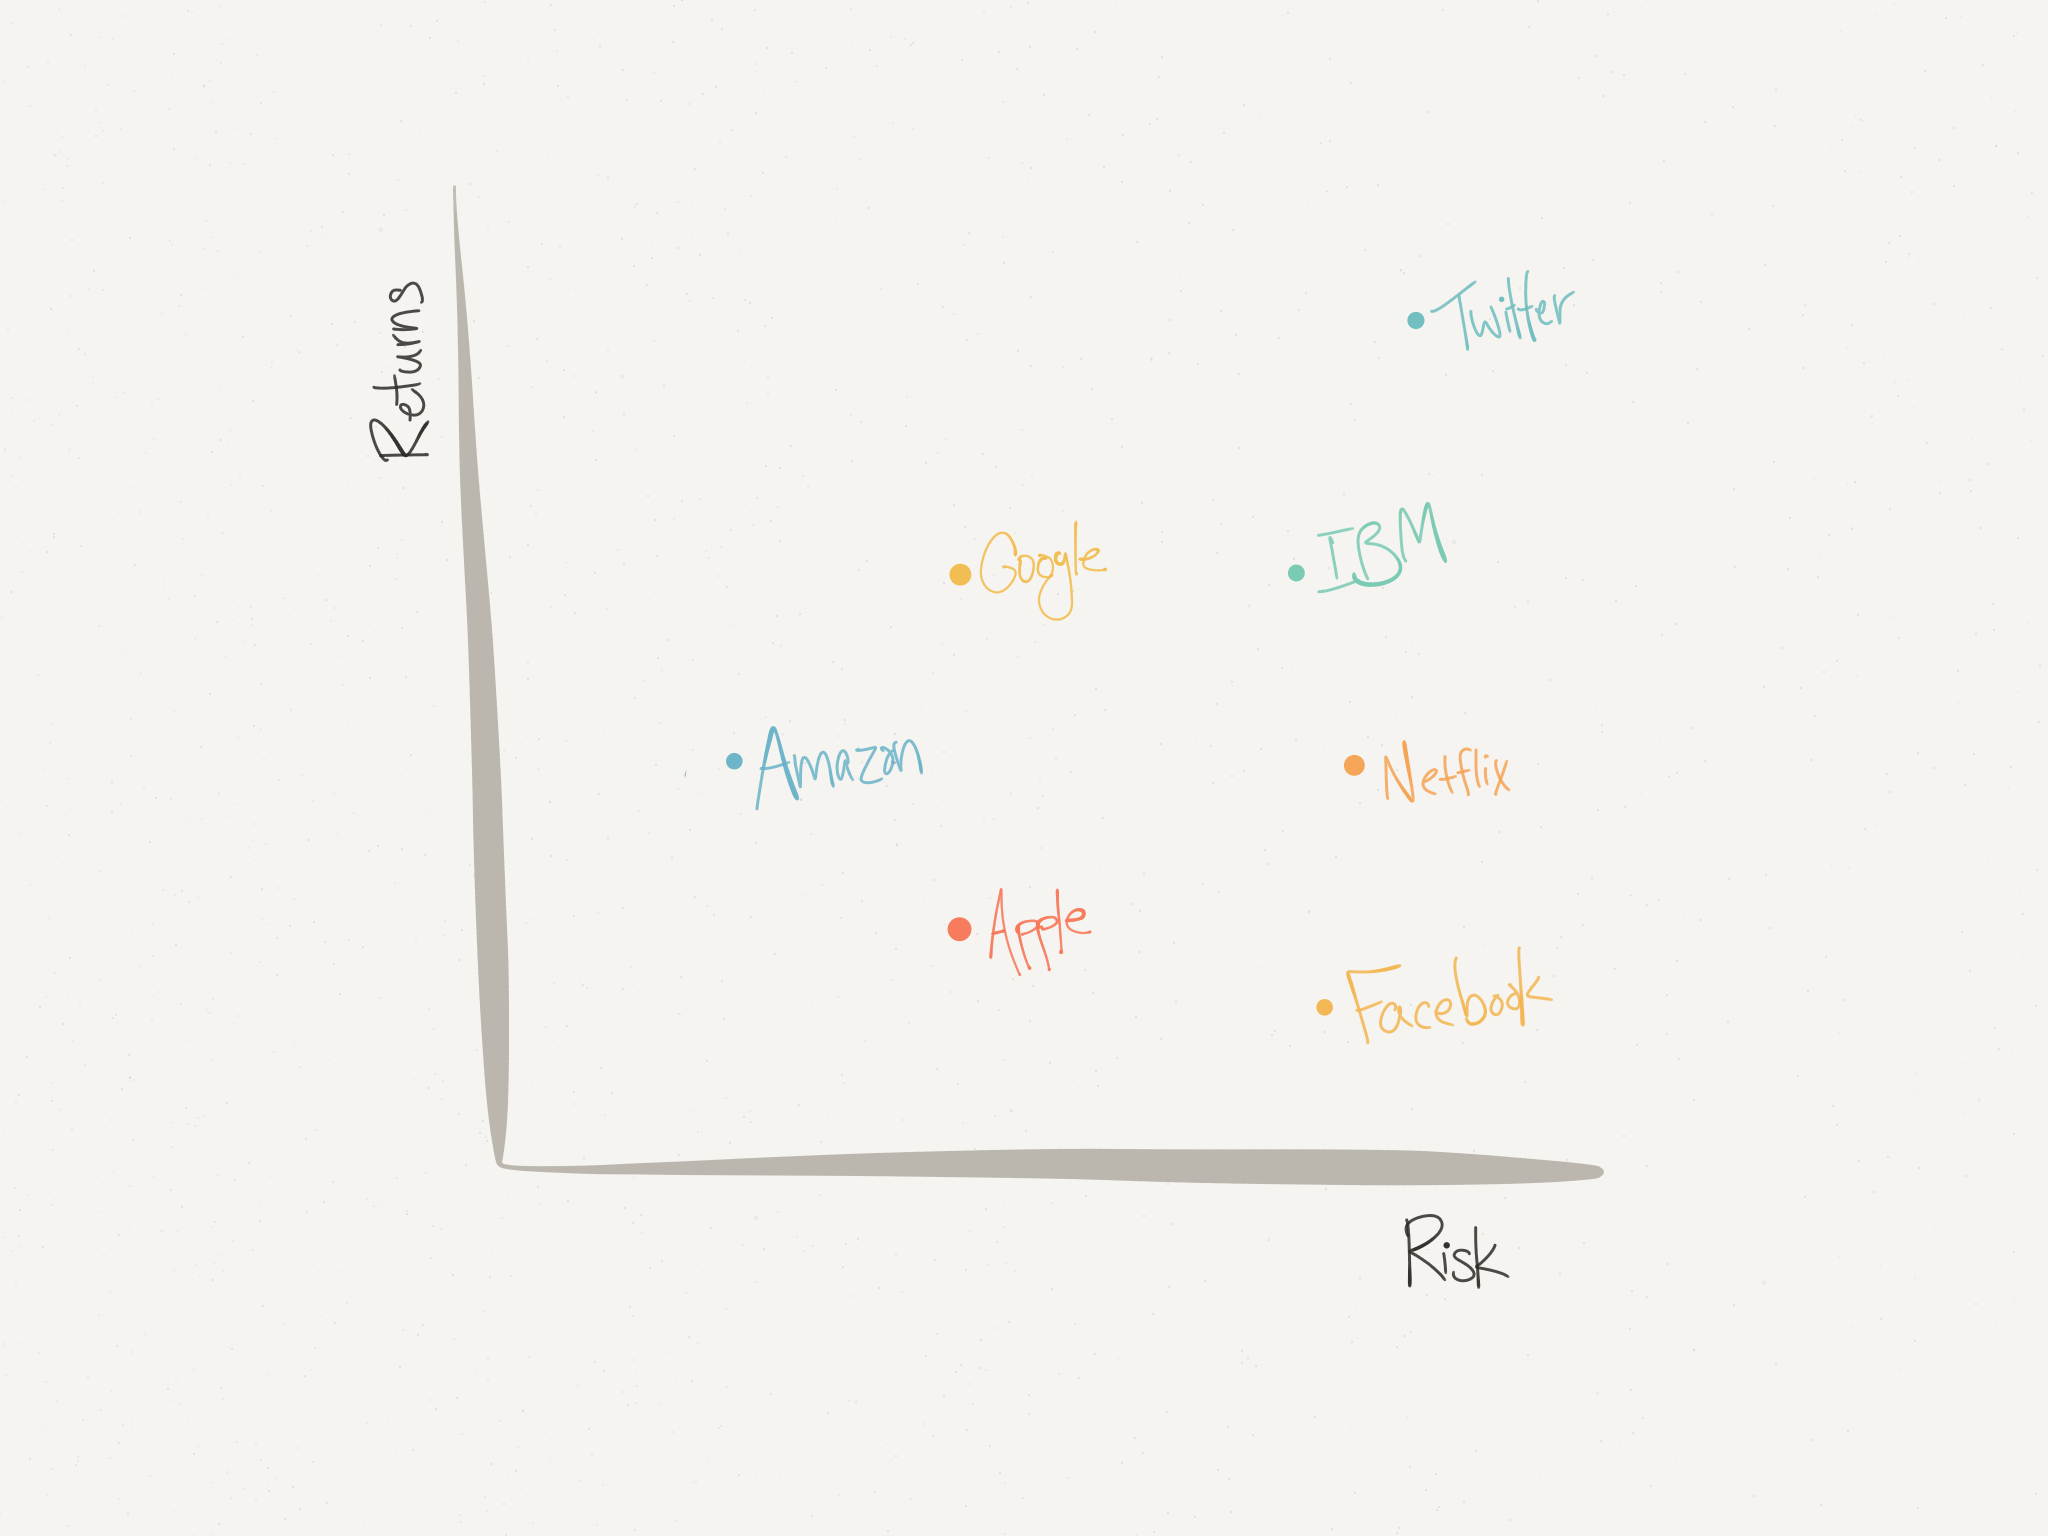
Portfolio theory compares risk/returns of hatchery
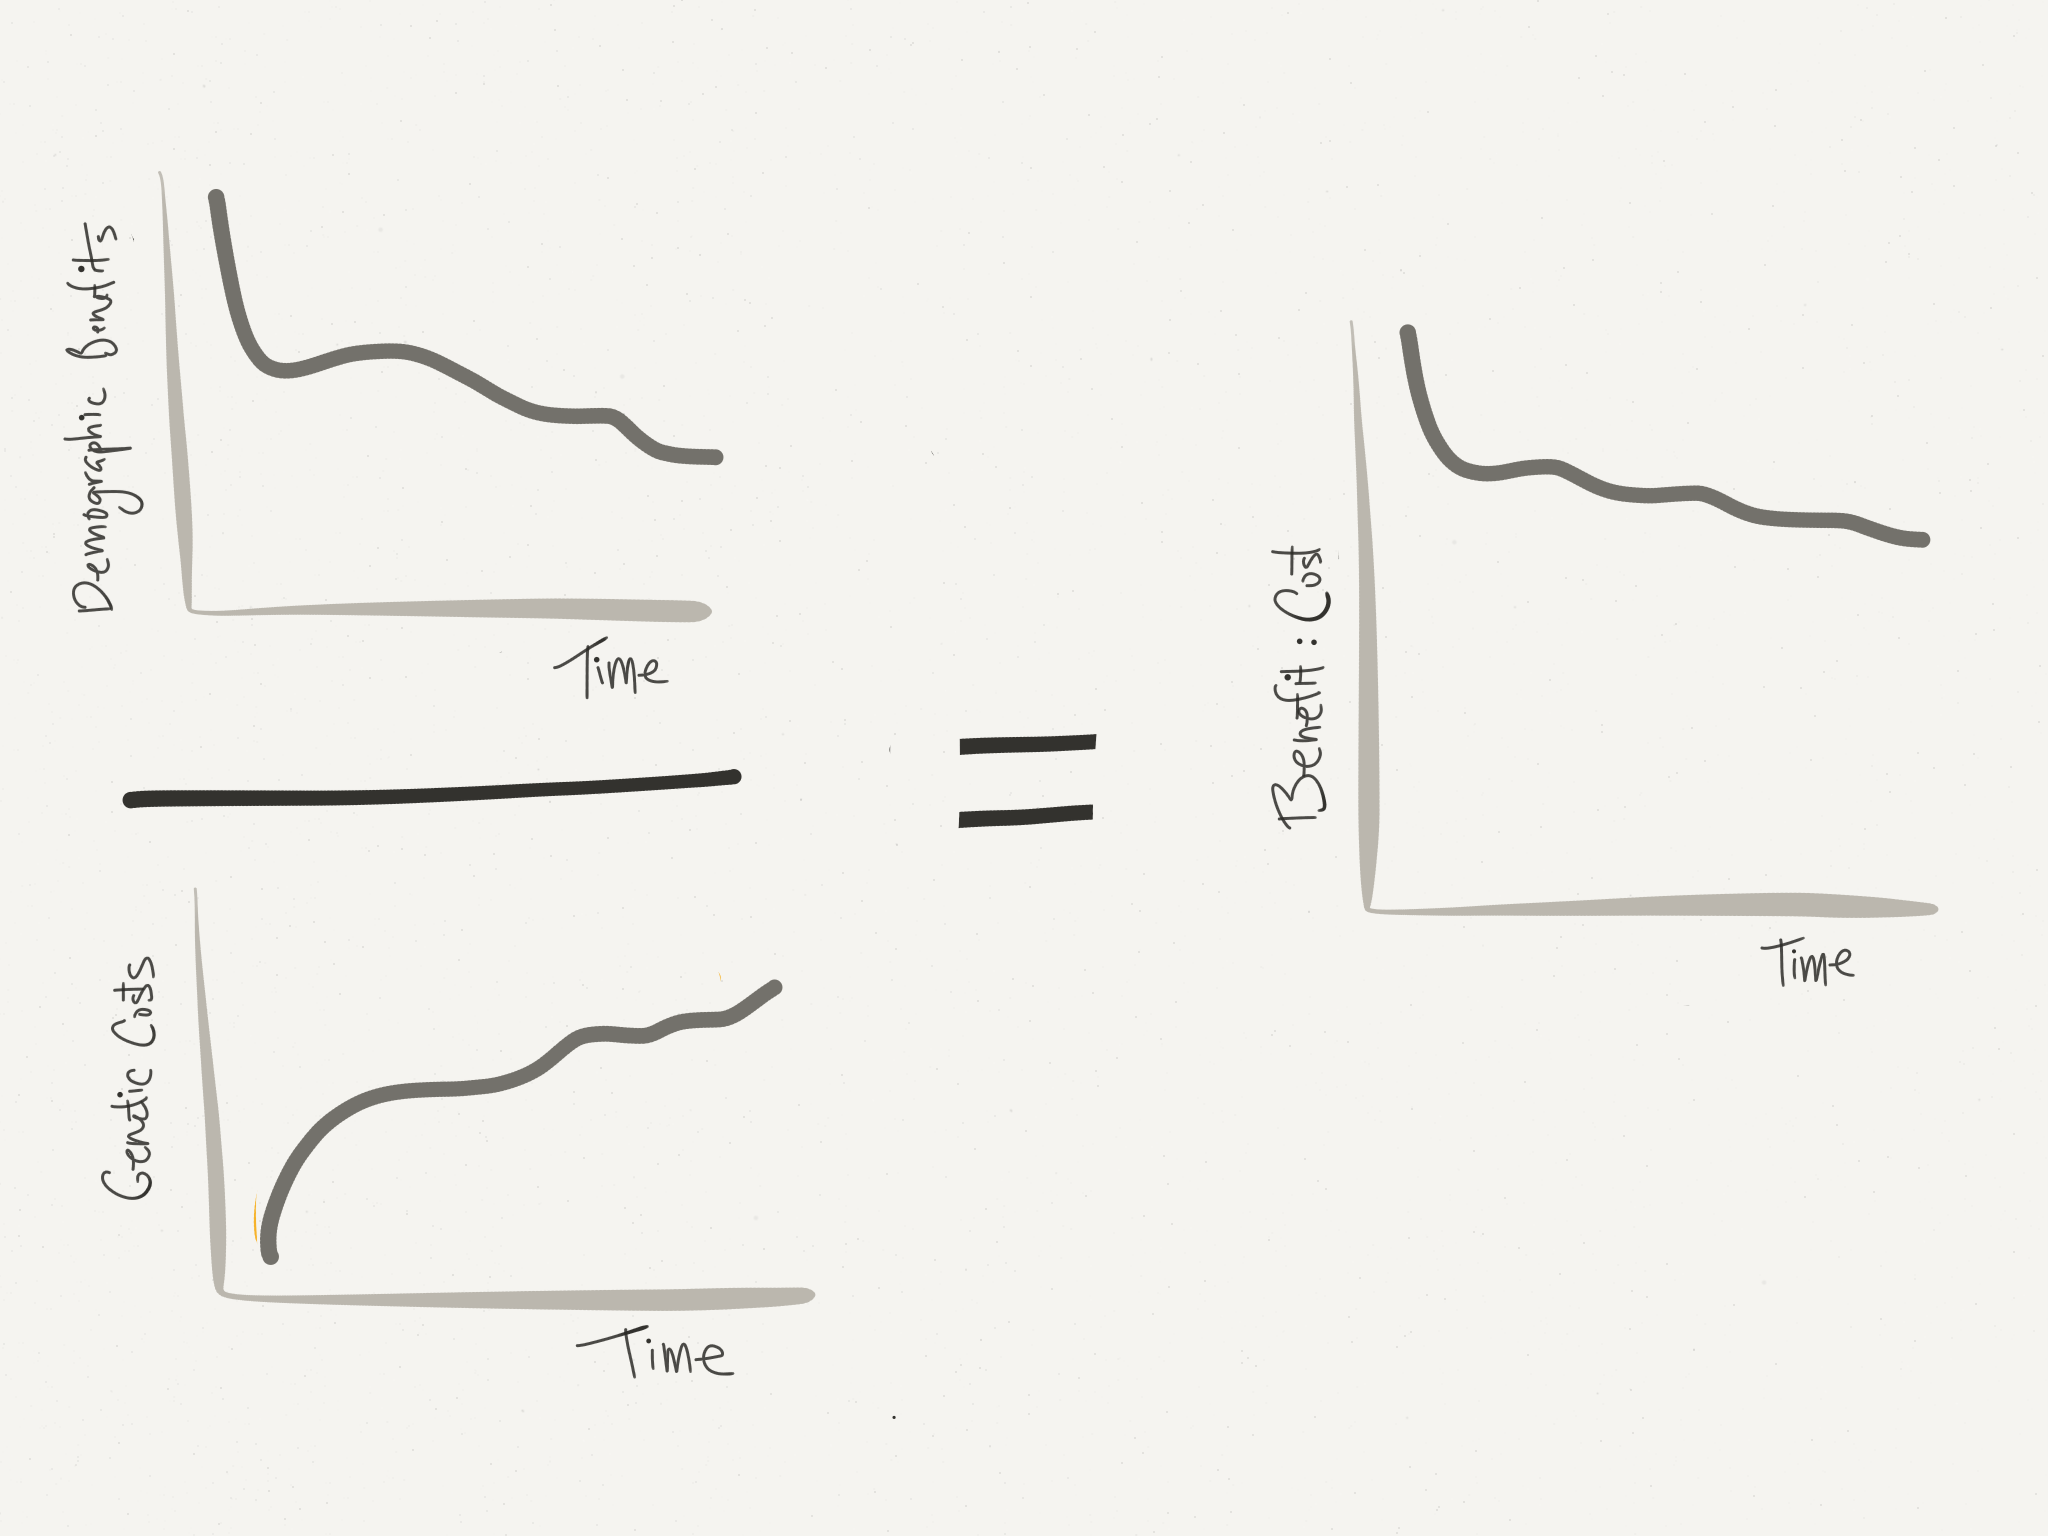
Portfolio theory compares risk/returns of hatchery
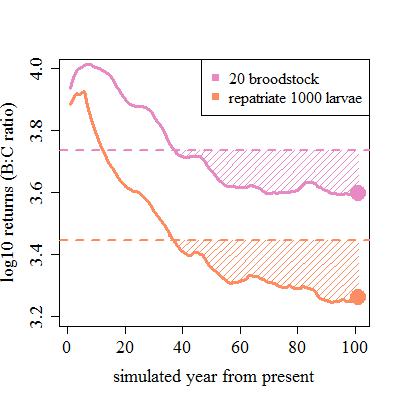
returns as benefit:cost ratio @ 100 years - represented here as a point
downside risks as below average returns - represented here by shading
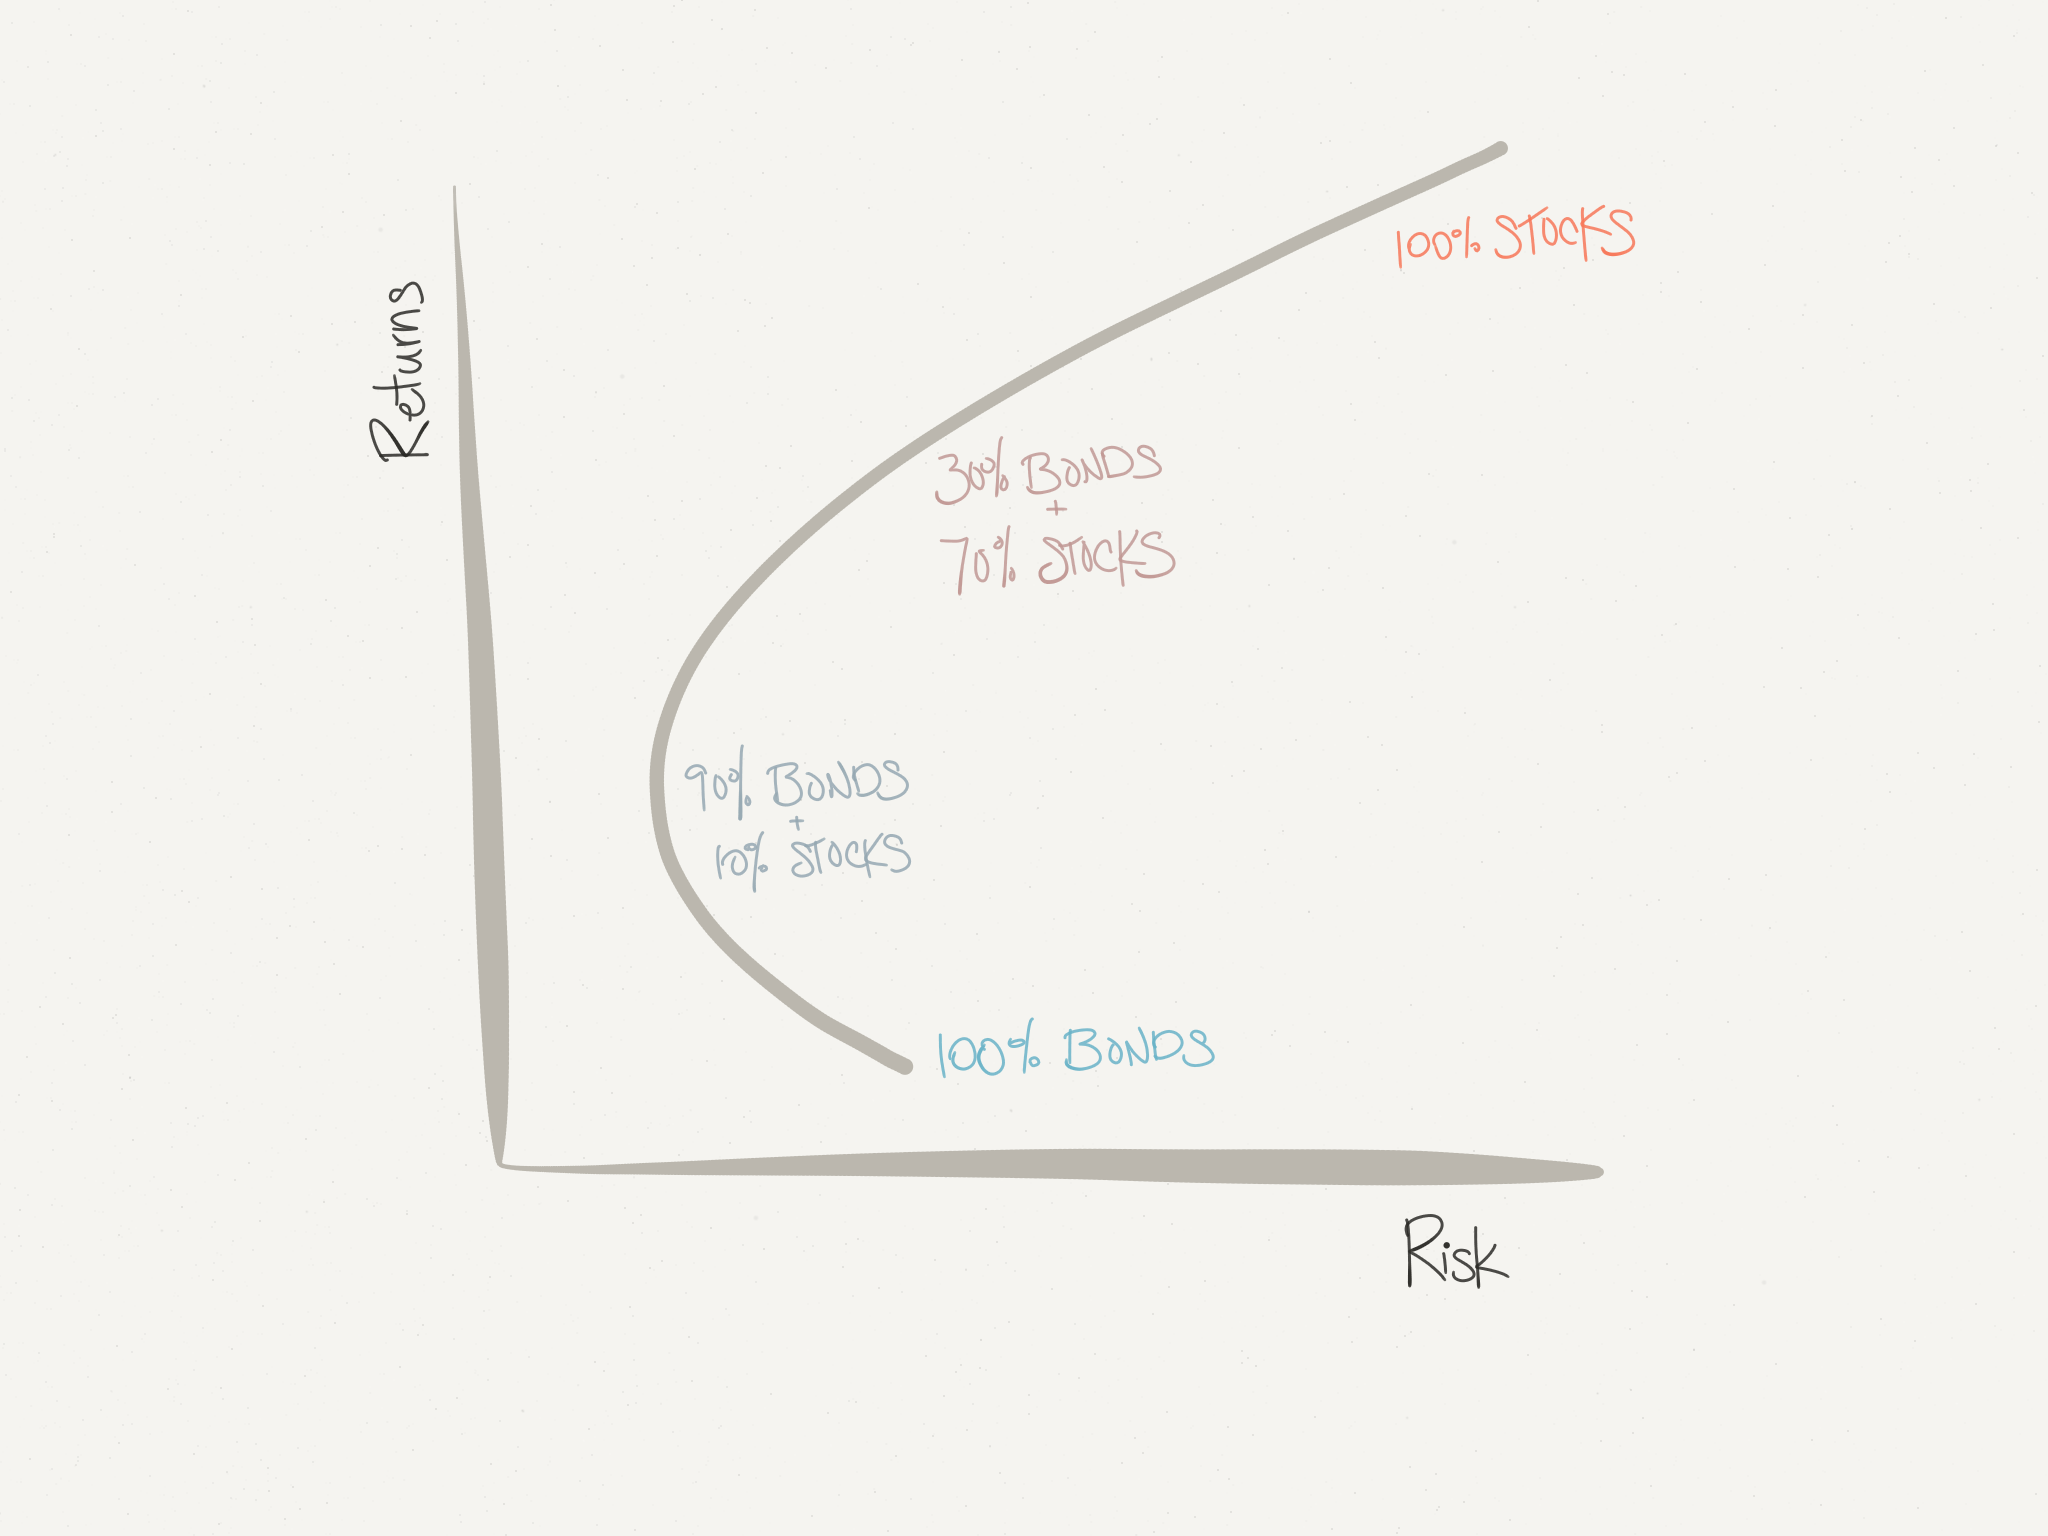
Portfolio theory as a neutral framework
Portfolio theory as a neutral framework
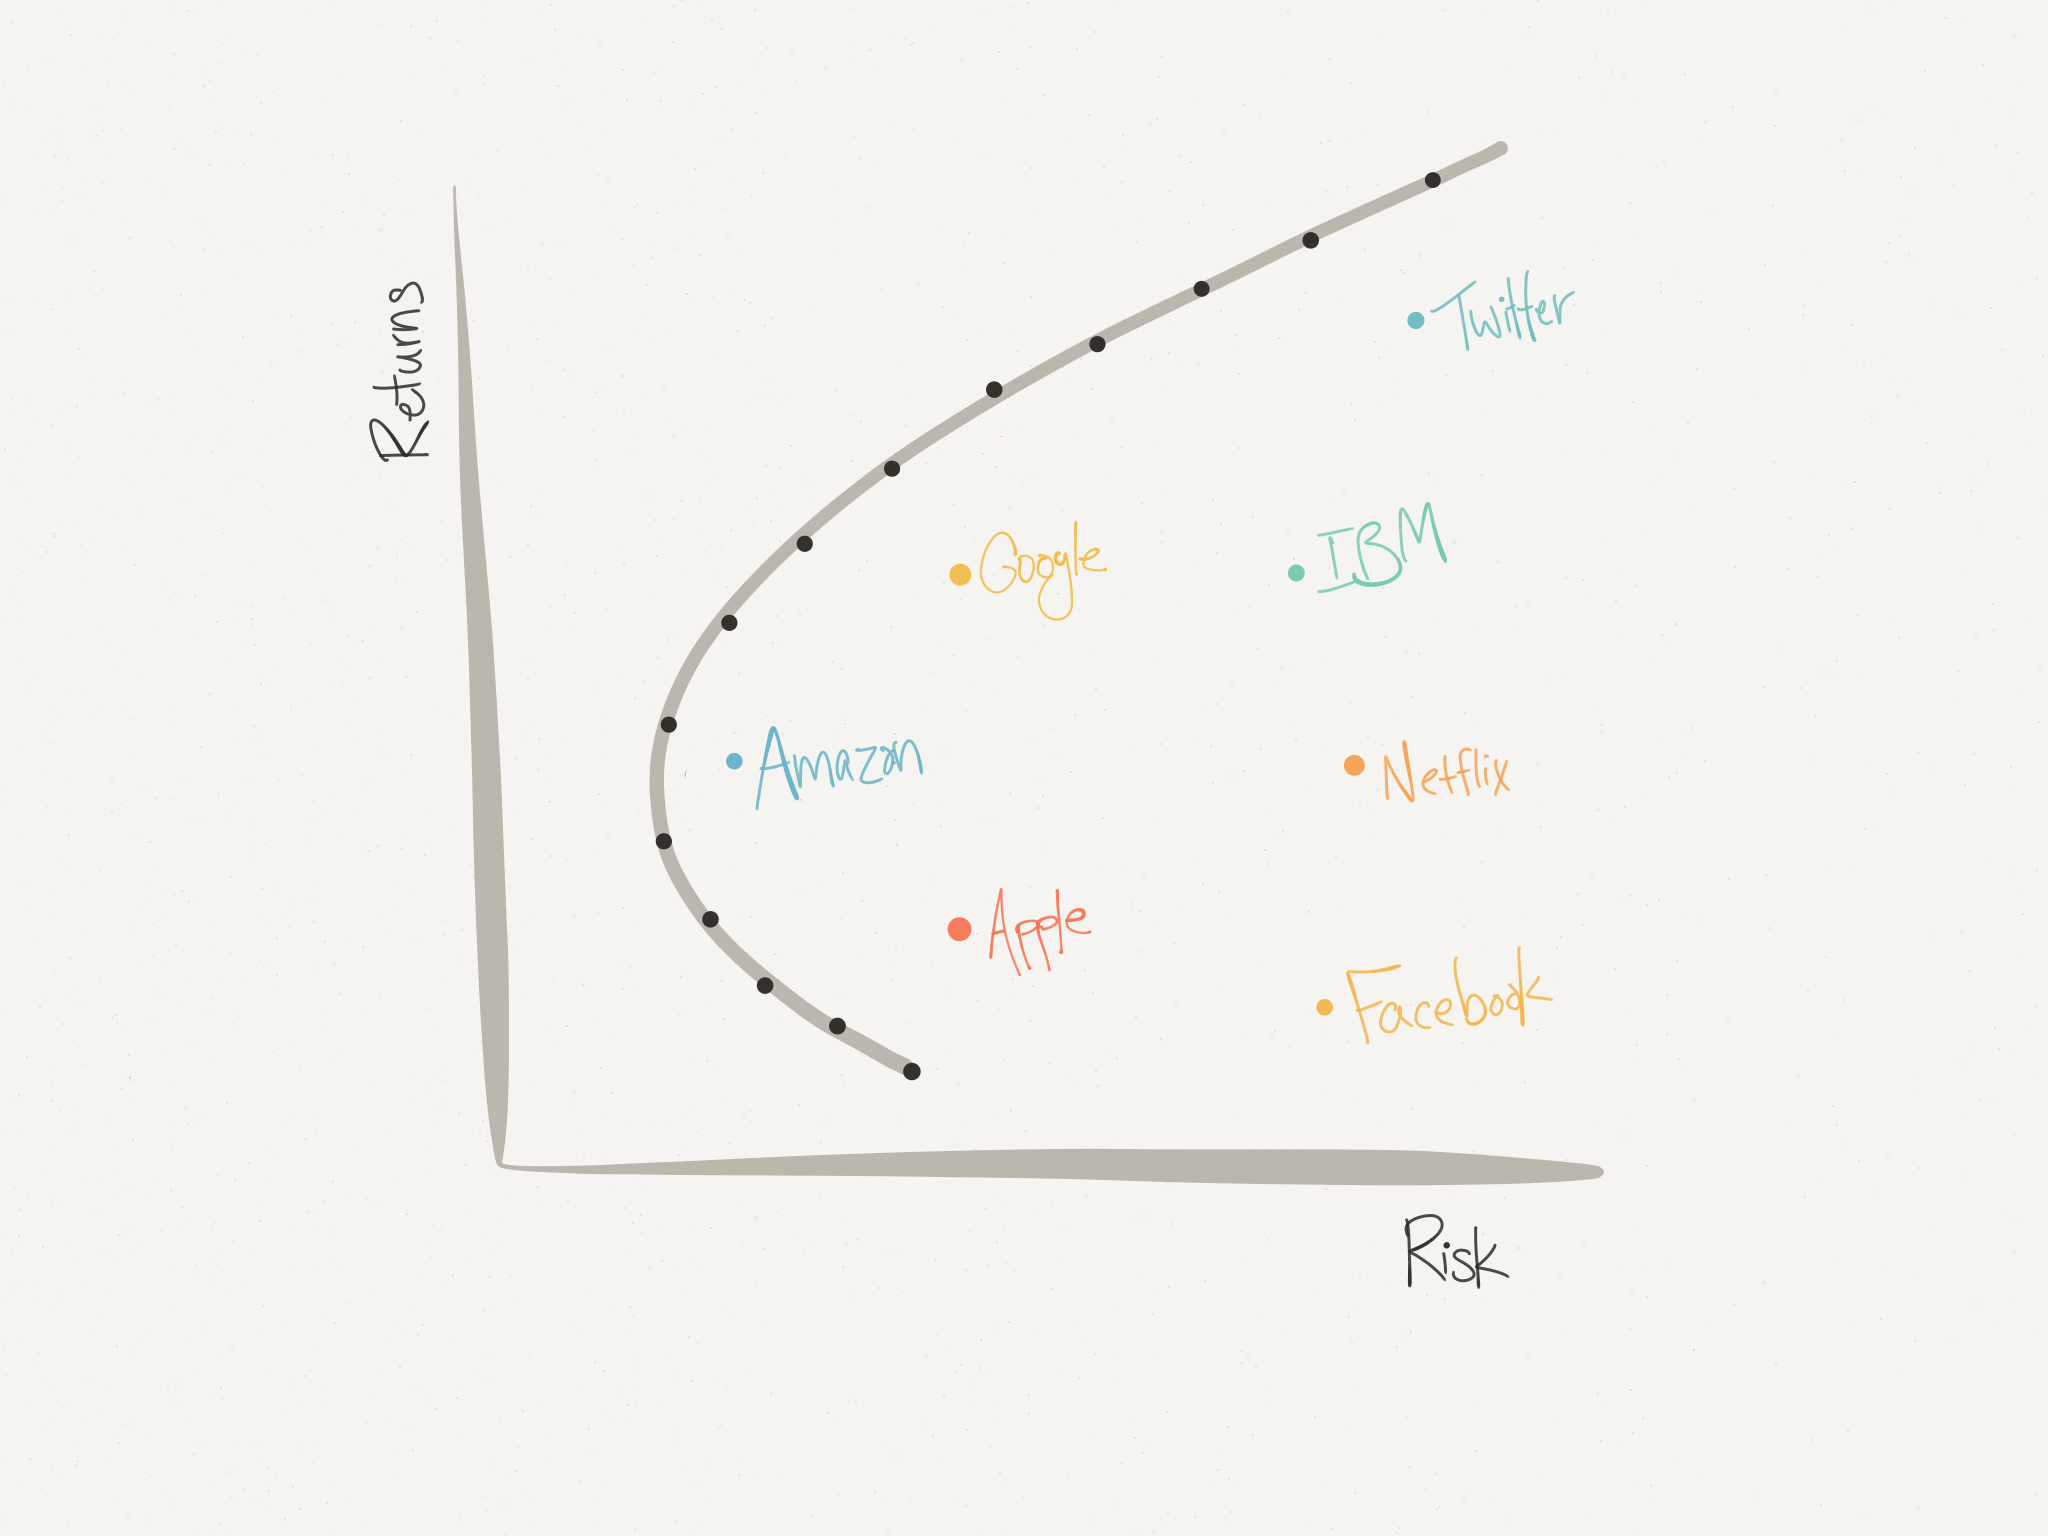
Portfolio theory as a neutral framework
Tradeoffs between Bliss and Brownlee
Few solutions efficient for both reaches
Research conclusions
 One efficient solution (10, no release limit)
Many suboptimal at upper/lower risk levels
 Two efficient solutions (750 or 850)
Many suboptimal at intermediate risk levels
Working Tasks
- Updating risk calculations with updated water quality data (Nate)
- Automating modification of input parameters for PVA (Nate)
- Improving spatial and temporal resolution of PVA by adapting shortnose model (Yetta)