
- Number 398 |
- September 30, 2013
Supercomputing the transition from ordinary to extraordinary forms of matter
RHIC’s detectors can pick up the fluctuations
in excesses of certain particles produced
from collision to collision, which are likely
signatures of the transition.
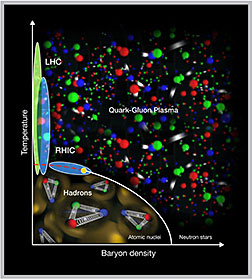
To get a better understanding of the subatomic soup that filled the early universe, and how it “froze out” to form the atoms of today’s world, scientists are taking a closer look at the nuclear phase diagram. Like a map that describes how the physical state of water morphs from solid ice to liquid to steam with changes in temperature and pressure, the nuclear phase diagram maps out different phases of the components of atomic nuclei—from the free quarks and gluons that existed at the dawn of time to the clusters of protons and neutrons that make up the cores of atoms today.
But “melting” atoms and their subatomic building blocks is far more difficult than taking an ice cube out of the freezer on a warm day. It requires huge particle accelerators like the Relativistic Heavy Ion Collider, a nuclear physics scientific user facility at DOE's Brookhaven National Laboratory, to smash atomic nuclei together at close to the speed of light, and sophisticated detectors and powerful supercomputers to help physicists make sense of what comes out. By studying the collision debris and comparing experimental observations with predictions from complex calculations, physicists at Brookhaven are plotting specific points on the nuclear phase diagram to reveal details of this extraordinary transition.
RHIC’s detectors can pick up the fluctuations in excesses of certain particles produced from collision to collision, which are likely signatures of the transition. But they can’t measure precisely the temperatures or densities at which those fluctuations were produced—the data you need to plot points on the phase diagram map.
“That’s where the supercomputers come in,” said Frithjof Karsch, a theoretical physicist at Brookhaven who is mapping out this new terrain.
Supercomputers can simulate the types of fluctuations expected for the wide range of temperatures and densities at RHIC. They start by mathematically modeling all the possible interactions of subatomic quarks and gluons as governed by the theory of Quantum Chromodynamics (QCD), which includes variables such as temperature and density in its equations.
Because the number of values for these and many other variables in QCD is very large, only supercomputers can handle the calculations. To simplify the problem, the computers look at interactions of quarks and gluons placed at discrete points on an imaginary four-dimensional “lattice” that accounts for three spatial dimensions plus time. The lattice consists of about 300,000 grid points, and on each point the values of 48 variables need to be adjusted to characterize a specific configuration of the interacting quarks and gluons. Supercomputers use Monte Carlo sampling—more or less trying random numbers, like rolling a pair of dice—to find the most probable configuration of these values.
“But there are many such configurations and we have to explore them all to allow for the many possible ways those quarks and gluons can interact,” said Karsch.
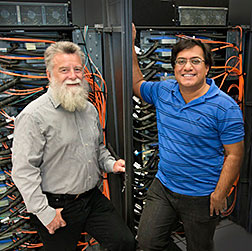
To build these lattice QCD configurations,
the scientists used Blue Gene
supercomputers of the New York State
Center for Computational Science.
To build these lattice QCD configurations, the scientists used Blue Gene supercomputers of the New York State Center for Computational Science, hosted by Brookhaven, as well as two new prototype racks of the Blue Gene/Q supercomputers at Brookhaven and at the RIKEN/BNL Research Center—a center founded and funded by the Japanese RIKEN laboratory in a cooperative agreement with Brookhaven. The machines turned out over 10,000 of these most probable configurations for each temperature.
The scientists then loaded the lattice configurations onto a different kind of supercomputer—the Graphic Processing Unit (GPU) cluster operated by the US based lattice QCD consortium, USQCD, at DOE’s Thomas Jefferson Accelerator Laboratory and another GPU cluster at Bielefeld University in Germany.
“GPUs are the kinds of computers that were invented to make video games,” said Brookhaven theoretical physicist Swagato Mukherjee, who coordinated the simulations and analysis. “They have very fast processors that can perform many simultaneous operations and draw every single pixel at the same time. That’s what you need to see fast-moving graphics, but it’s also very useful for these complex physics problems where we need to perform many simultaneous repetitive operations on each of the stored configurations to calculate the fluctuations of the excess particle numbers.”
The scientists used 800 GPUs at Jefferson Lab and at Bielefeld University to analyze their 10,000 most probable configurations at each temperature and calculated the fluctuations of excess particle numbers for various combinations of temperature and density. By matching the fluctuations measured in real RHIC collisions at a given beam energy with the calculated values, they could use the supercomputed calculations to identify the temperature and density at which those fluctuations took place. Repeating the process for many experimentally measured values of fluctuations over the wide range of beam energies available at RHIC is helping scientists plot the line on the map that shows how the transition from quark soup to ordinary matter changes with temperature and density.
The scientists are now preparing for a new round of simulations, ideally using the world’s largest supercomputer, TITAN, at Oak Ridge National Laboratory, which combines more than 18,000 GPUs. With that processing power analyzing existing data and future collisions at RHIC, the researchers will continue to narrow the search for landmarks on the nuclear phase diagram and expand our understanding of how the matter of the early universe transformed into the stuff of our familiar everyday world.
The supercomputing analyses of QCD and RHIC data are funded by the DOE Office of Science.Submitted by DOE’s Brookhaven National Laboratory