
- Number 326 |
- December 6, 2010
Seismic surveys track carbon dioxide movement underground
NETL researchers are
measuring fluid flow at
pressures and temperatures
that are representative of
conditions deep underground,
and determining the effect that
changing the amount of CO2 or
other fluids has on ultrasonic
seismic signal velocities in the
rock.
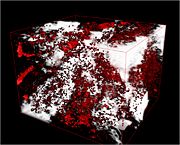
This image, created by
computerized tomography
(CT), shows connected pores
in white and unconnected pores
in red, within a sample of a rock
type that may eventually be
used to sequester carbon
dioxide; the rectangular cube
shown is 1.54 x 1.40 x 1.12 mm.
Researchers at DOE's National Energy Technology Laboratory and collaborators at the University of Pittsburgh have developed a correlation between acoustic wave velocities measured in the laboratory and relative carbon dioxide (CO2) saturation, which allows researchers to calibrate and refine the interpretation of seismic reflection surveys. The researchers are able to simulate the flow of CO2 in a core sample of reservoir rock at the temperatures and pressures that are encountered deep underground, and then measure how the amount of CO2 present affects how seismic energy moves through the rock. Recent laboratory tests showed that there is a marked decrease in signal velocity when CO2 is introduced into the pore space, and that this decrease is large enough to be detectable in a seismic survey. Although it was previously possible to observe apparent gas plumes underground, interpretation of the data was very complicated because of all of the unknowns, such as how different types of ultrasonic seismic signals are affected by the concentrations of various fluids at the temperatures and pressures encountered at various depths. So, it was assumed that the image changes were due to migration of the gas, but the margin of the migration was hard to define and the changes observed could possibly have reflected other changes caused by the injection, such as movement of other fluids, like brine. However, by conducting laboratory tests on actual samples of the rock that the seismic signals are passing through, the effects of CO2 can be more easily and more precisely measured, which in turn makes it possible to much more easily track the movement of the CO2 deep underground using surface instruments. In addition, subtle changes in the rock matrix, caused by the injection process and the CO2, can be much better understood after modeling these experiments.
[Linda Morton, 304.285.4543,
Linda.morton@netl.doe.gov]